Net Strategy Report
The Net Strategy report provides detailed information regarding the total cost of asset ownership, year on year, which includes the capital funding requirements, maintenance funding requirements and the change in asset backlog as a result of the modelled simulation.
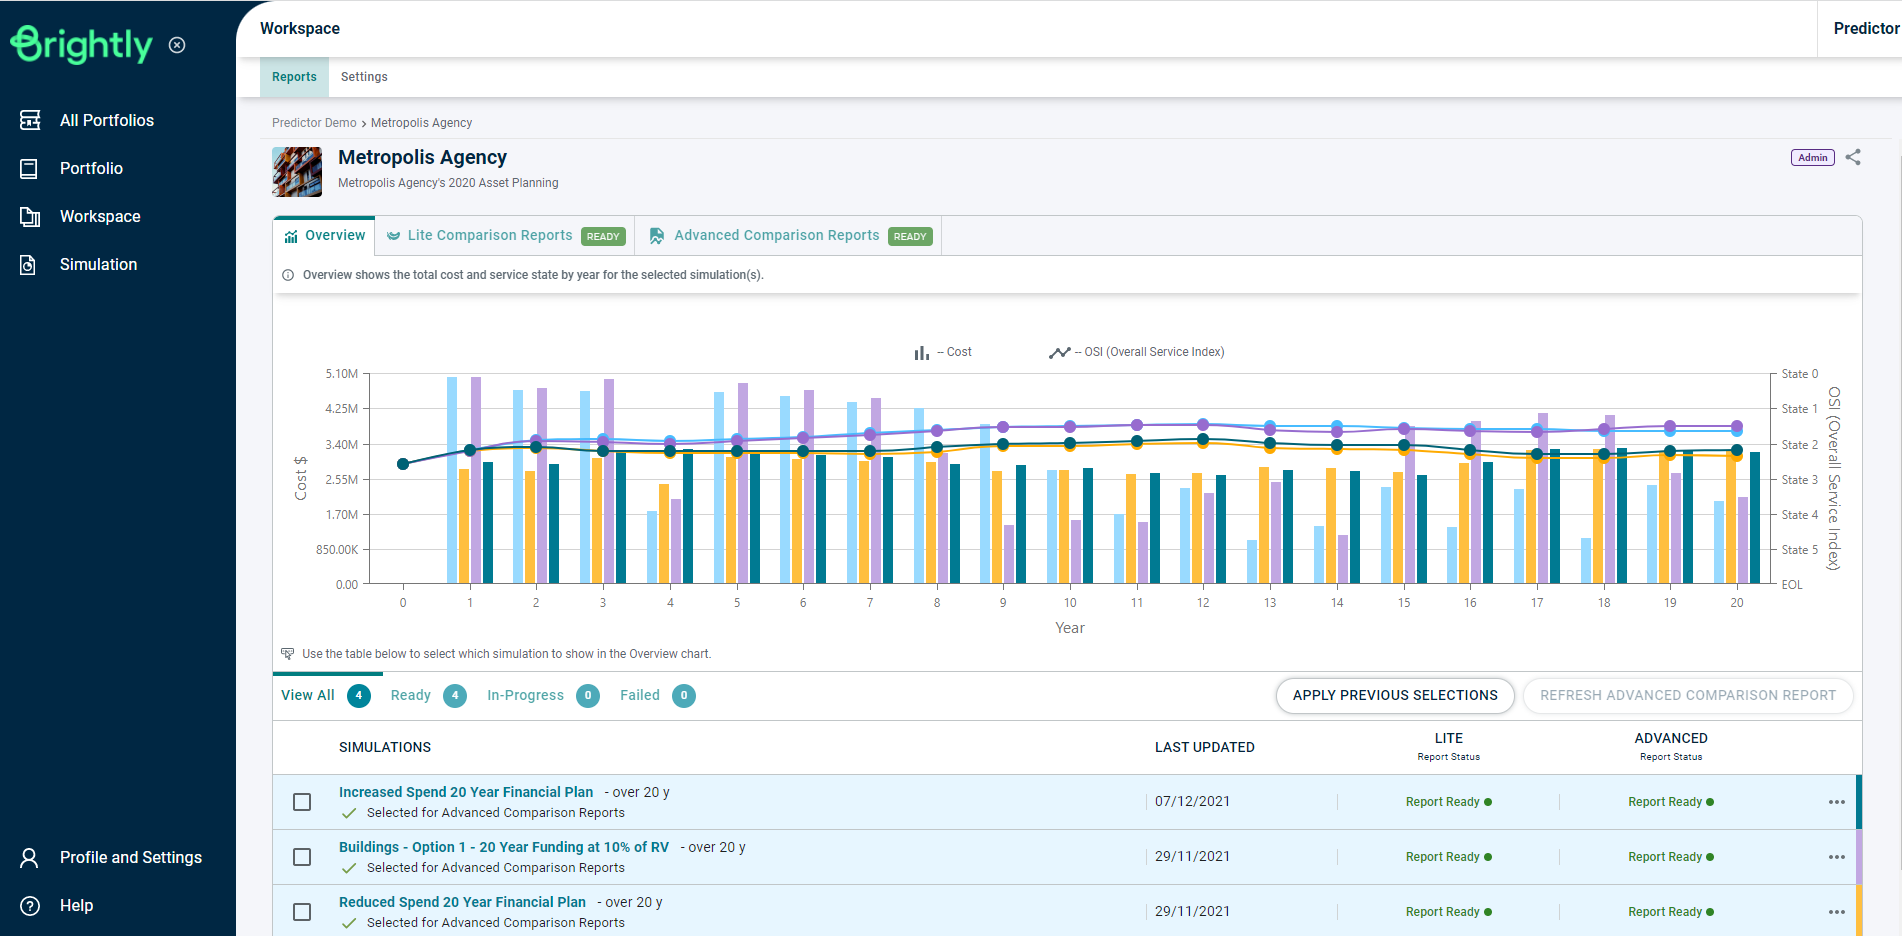
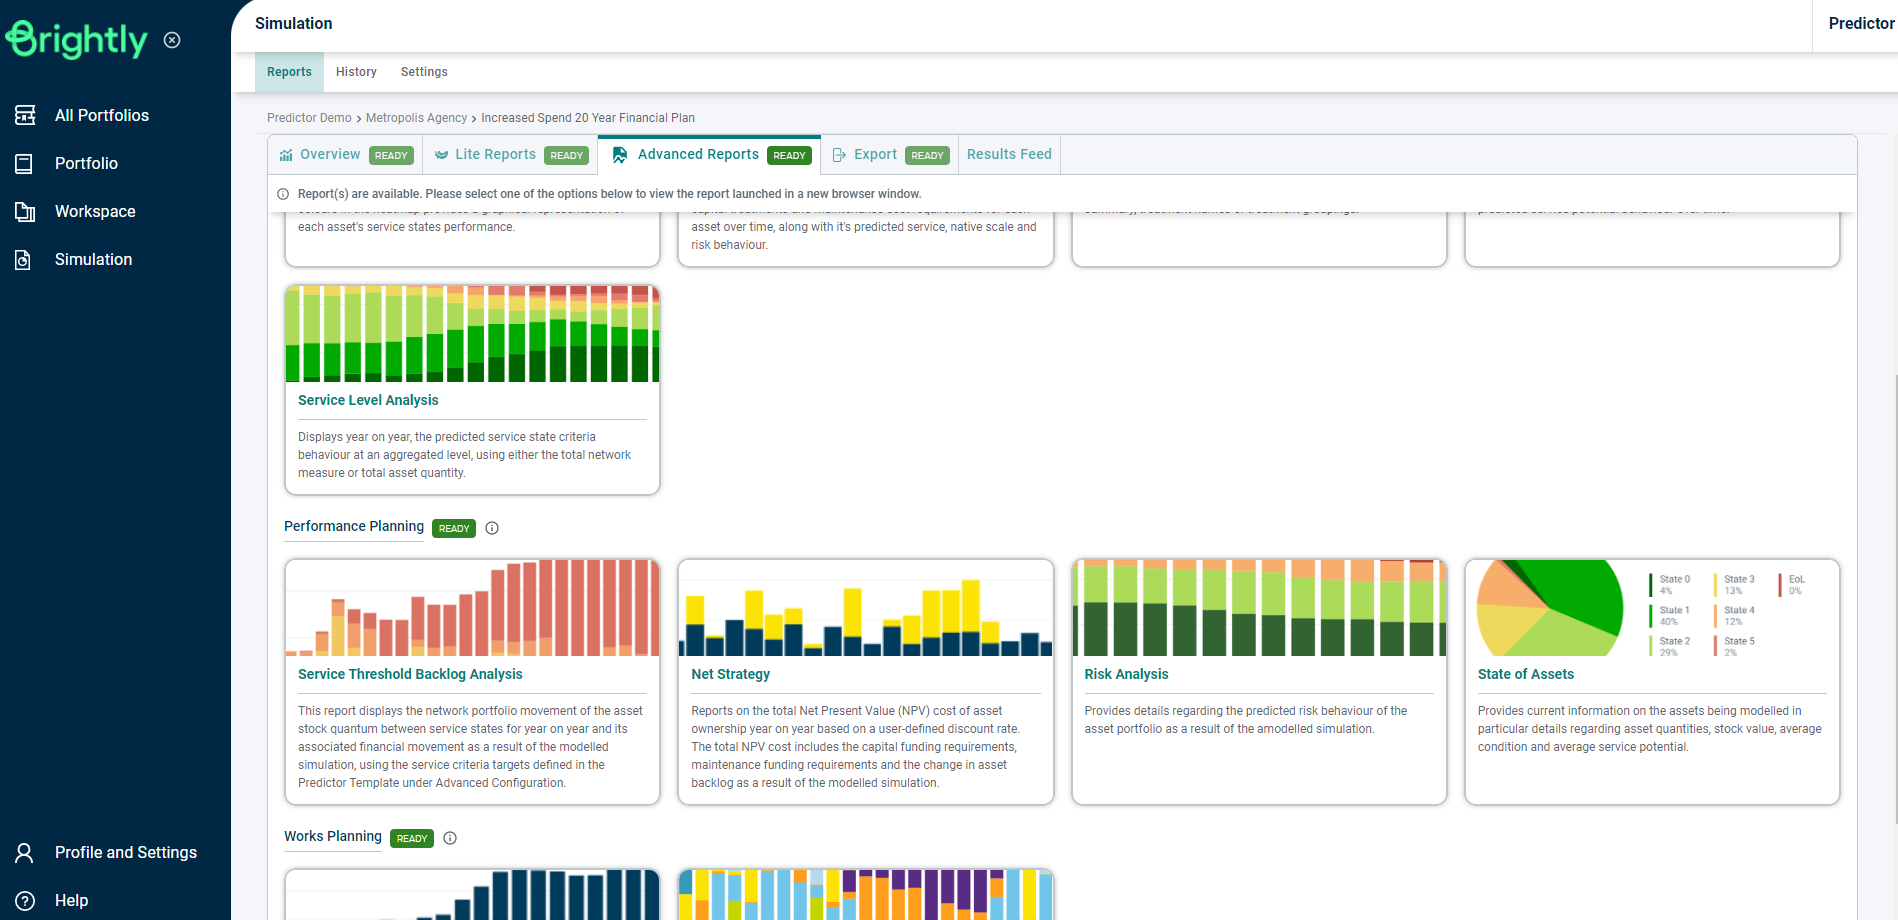
Once the Simulation is loaded, users can click on the 'Net Strategy' report in the Advanced Reports tab, under the Performance Planning section, or use the Search Reports box to locate the correct report.
This will load the Net Strategy report in a new browser tab.
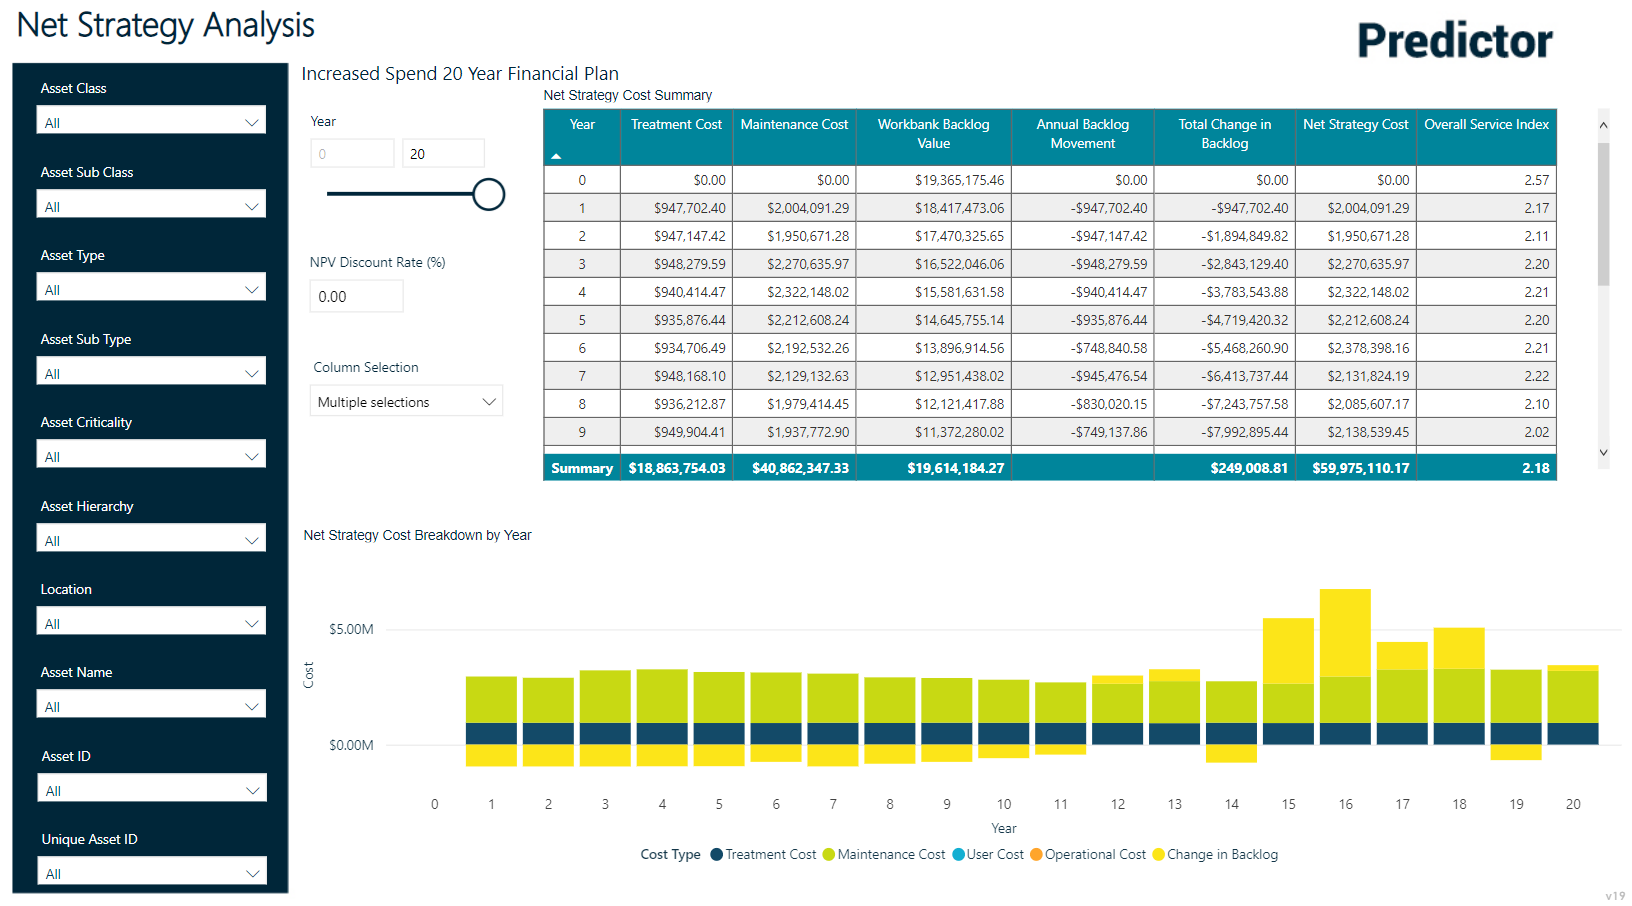
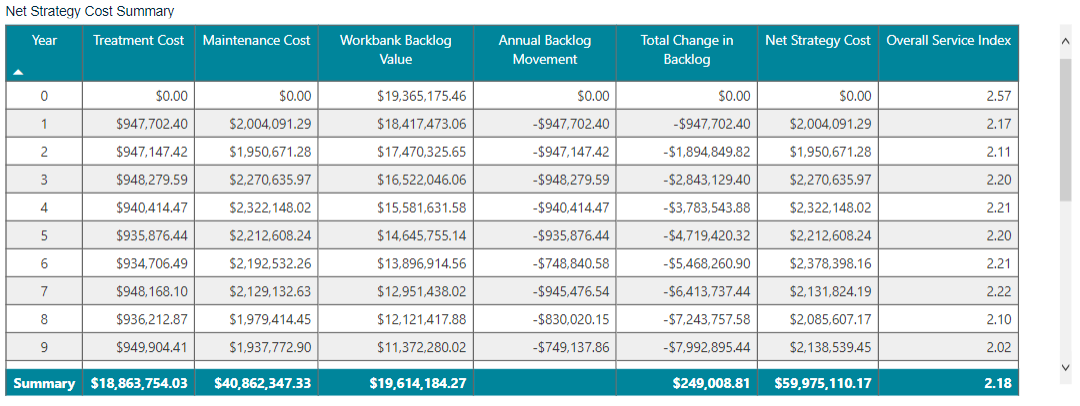
Detailed information on yearly costs, movements and changes within the asset backlog, and the overall service index can be found in the Net Strategy Cost Calculation section of the report.
The Net Strategy report will also display a graph outlining the total Net Strategy Cost per year for the current simulation, broken down further by each individual Cost Type.
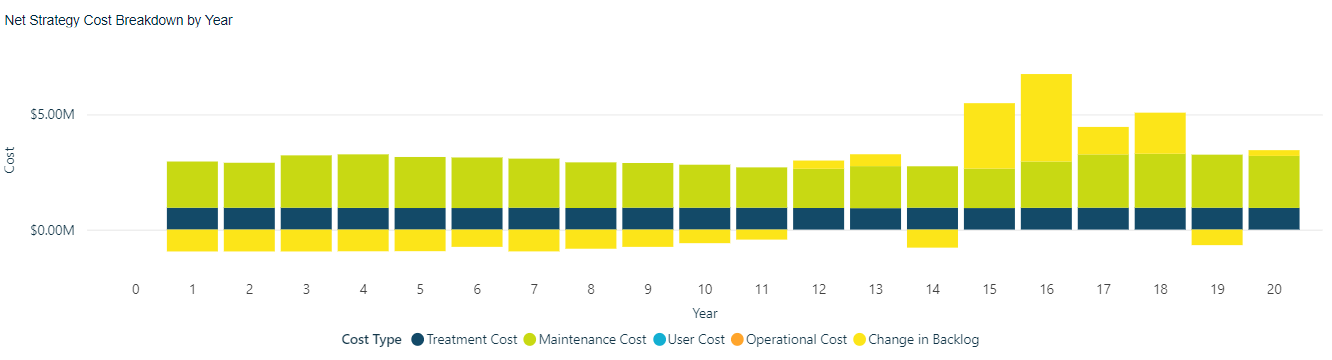
Users can modify the year range displayed by the report by moving the value slider, or by adjusting the year range value itself within the Year section.
Users can also input a Net Present Value discount rate:
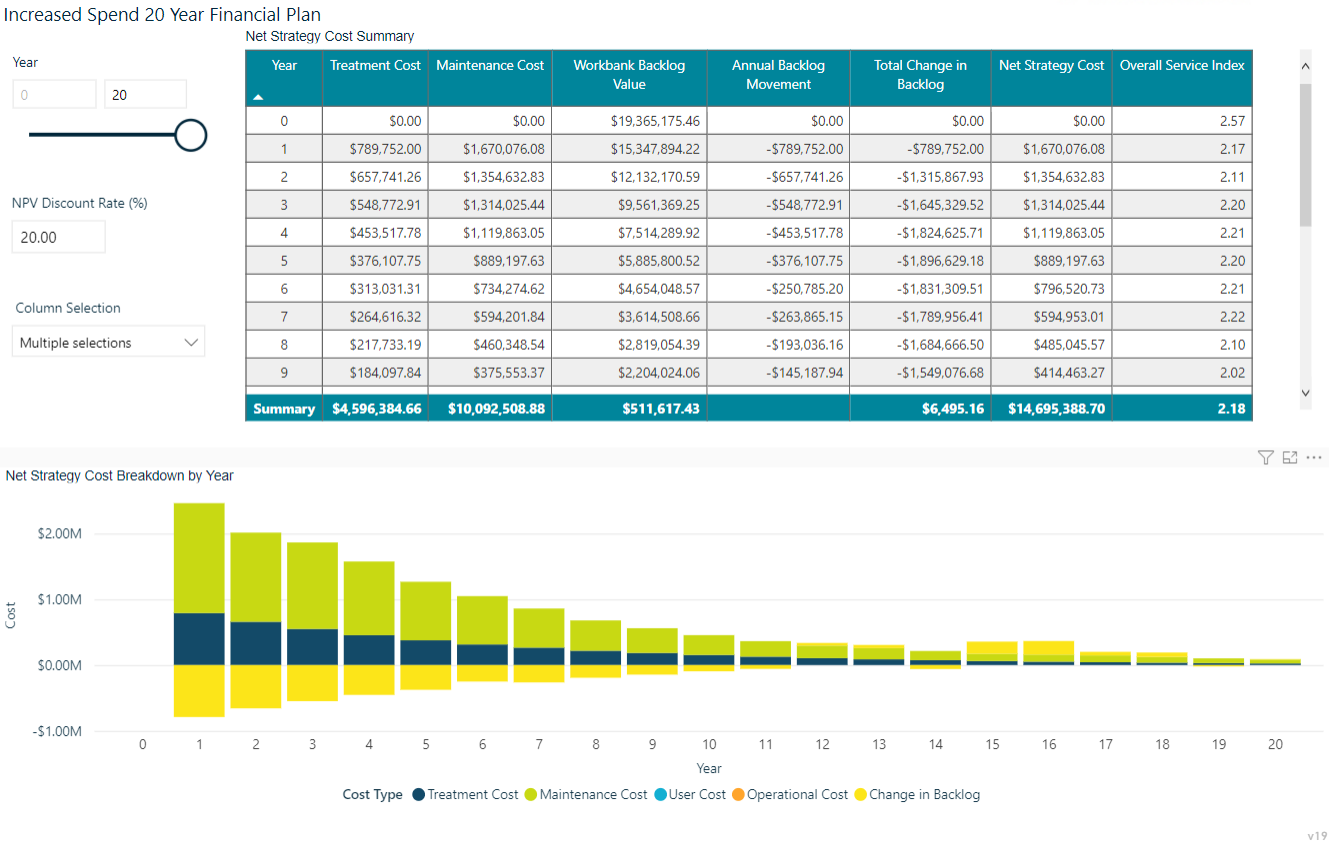
This discount rate is then applied to the calculations for treatment, maintenance, user, and operational costs.
